
Around the world, coal makes a vital contribution to the security of energy supply. It is a competitive fuel and adds economic value wherever it is used: for steelmaking, for cement production and, most importantly, for electricity and heat generation. A diverse energy mix with modest coal use can be part of a strategy that reduces risk and underpins sustainable economic growth.
The aim of this section is to give an overview of how coal production and use in the European Union fit with the wider global picture of growing coal consumption. Although it is impossible to forecast the future, it is instructive to look at current energy trends and examine how climate and energy policies will influence these trends.
Coal and sustainability
The European coal industry believes that the three energy sustainability objectives – security of supply, competitiveness and environmental compatibility, including climate protection – must be pursued with equal vigour. Europe’s energy sector faces considerable challenges to ensure security of energy supplies and investment in new energy infrastructure. Conventional thermal power generation, including nuclear power plants and, to an even greater extent, coal-, lignite- and gas-fired power plants, will continue to be needed for some years to come, so they need to be sustainable.

Figure 13 – The energy trilemma according to the World Energy Council (Source: WEC, 2022)
A key requirement for sustainable energy supplies in Europe is competitiveness. Energy at affordable and equitable prices helps to maintain the competitiveness of European industry as a whole and allows citizens to enjoy a high standard of living.
In 2021, even after accounting for exports, the EU imported 57.1% of all the energy it consumed: 95.1% of its crude oil needs, 83.5% of its fossil gas and 37.5% of its coal. This import dependency is rising. Managing energy supply risks was an integral part of the Energy Union strategy of 2015. Two essential elements of a secure energy system are a diversity of energy sources and a diversity of energy technologies. A diverse energy mix, comprising indigenous and imported energy sources, including hard coal and lignite, helps to limit supply risks.
Electric power is no longer generated using conventional hydro, coal, gas and nuclear energy alone. Today, new renewable energy sources, mainly wind turbines and solar PV, are growing in importance, but still require reliable backup from conventional sources, at least until large-scale electricity storage options become available. By valuing the flexibility and reliability of coal- and lignite-fired power generation, there is great scope for deploying renewables to the maximum possible extent. The key to Europe’s future power generation lies in a broad mix of energy sources, so that supply risks are minimised, reliability maximised, affordable electricity enjoyed, and further progress made in environmental and climate protection towards net-zero emissions by 2050.
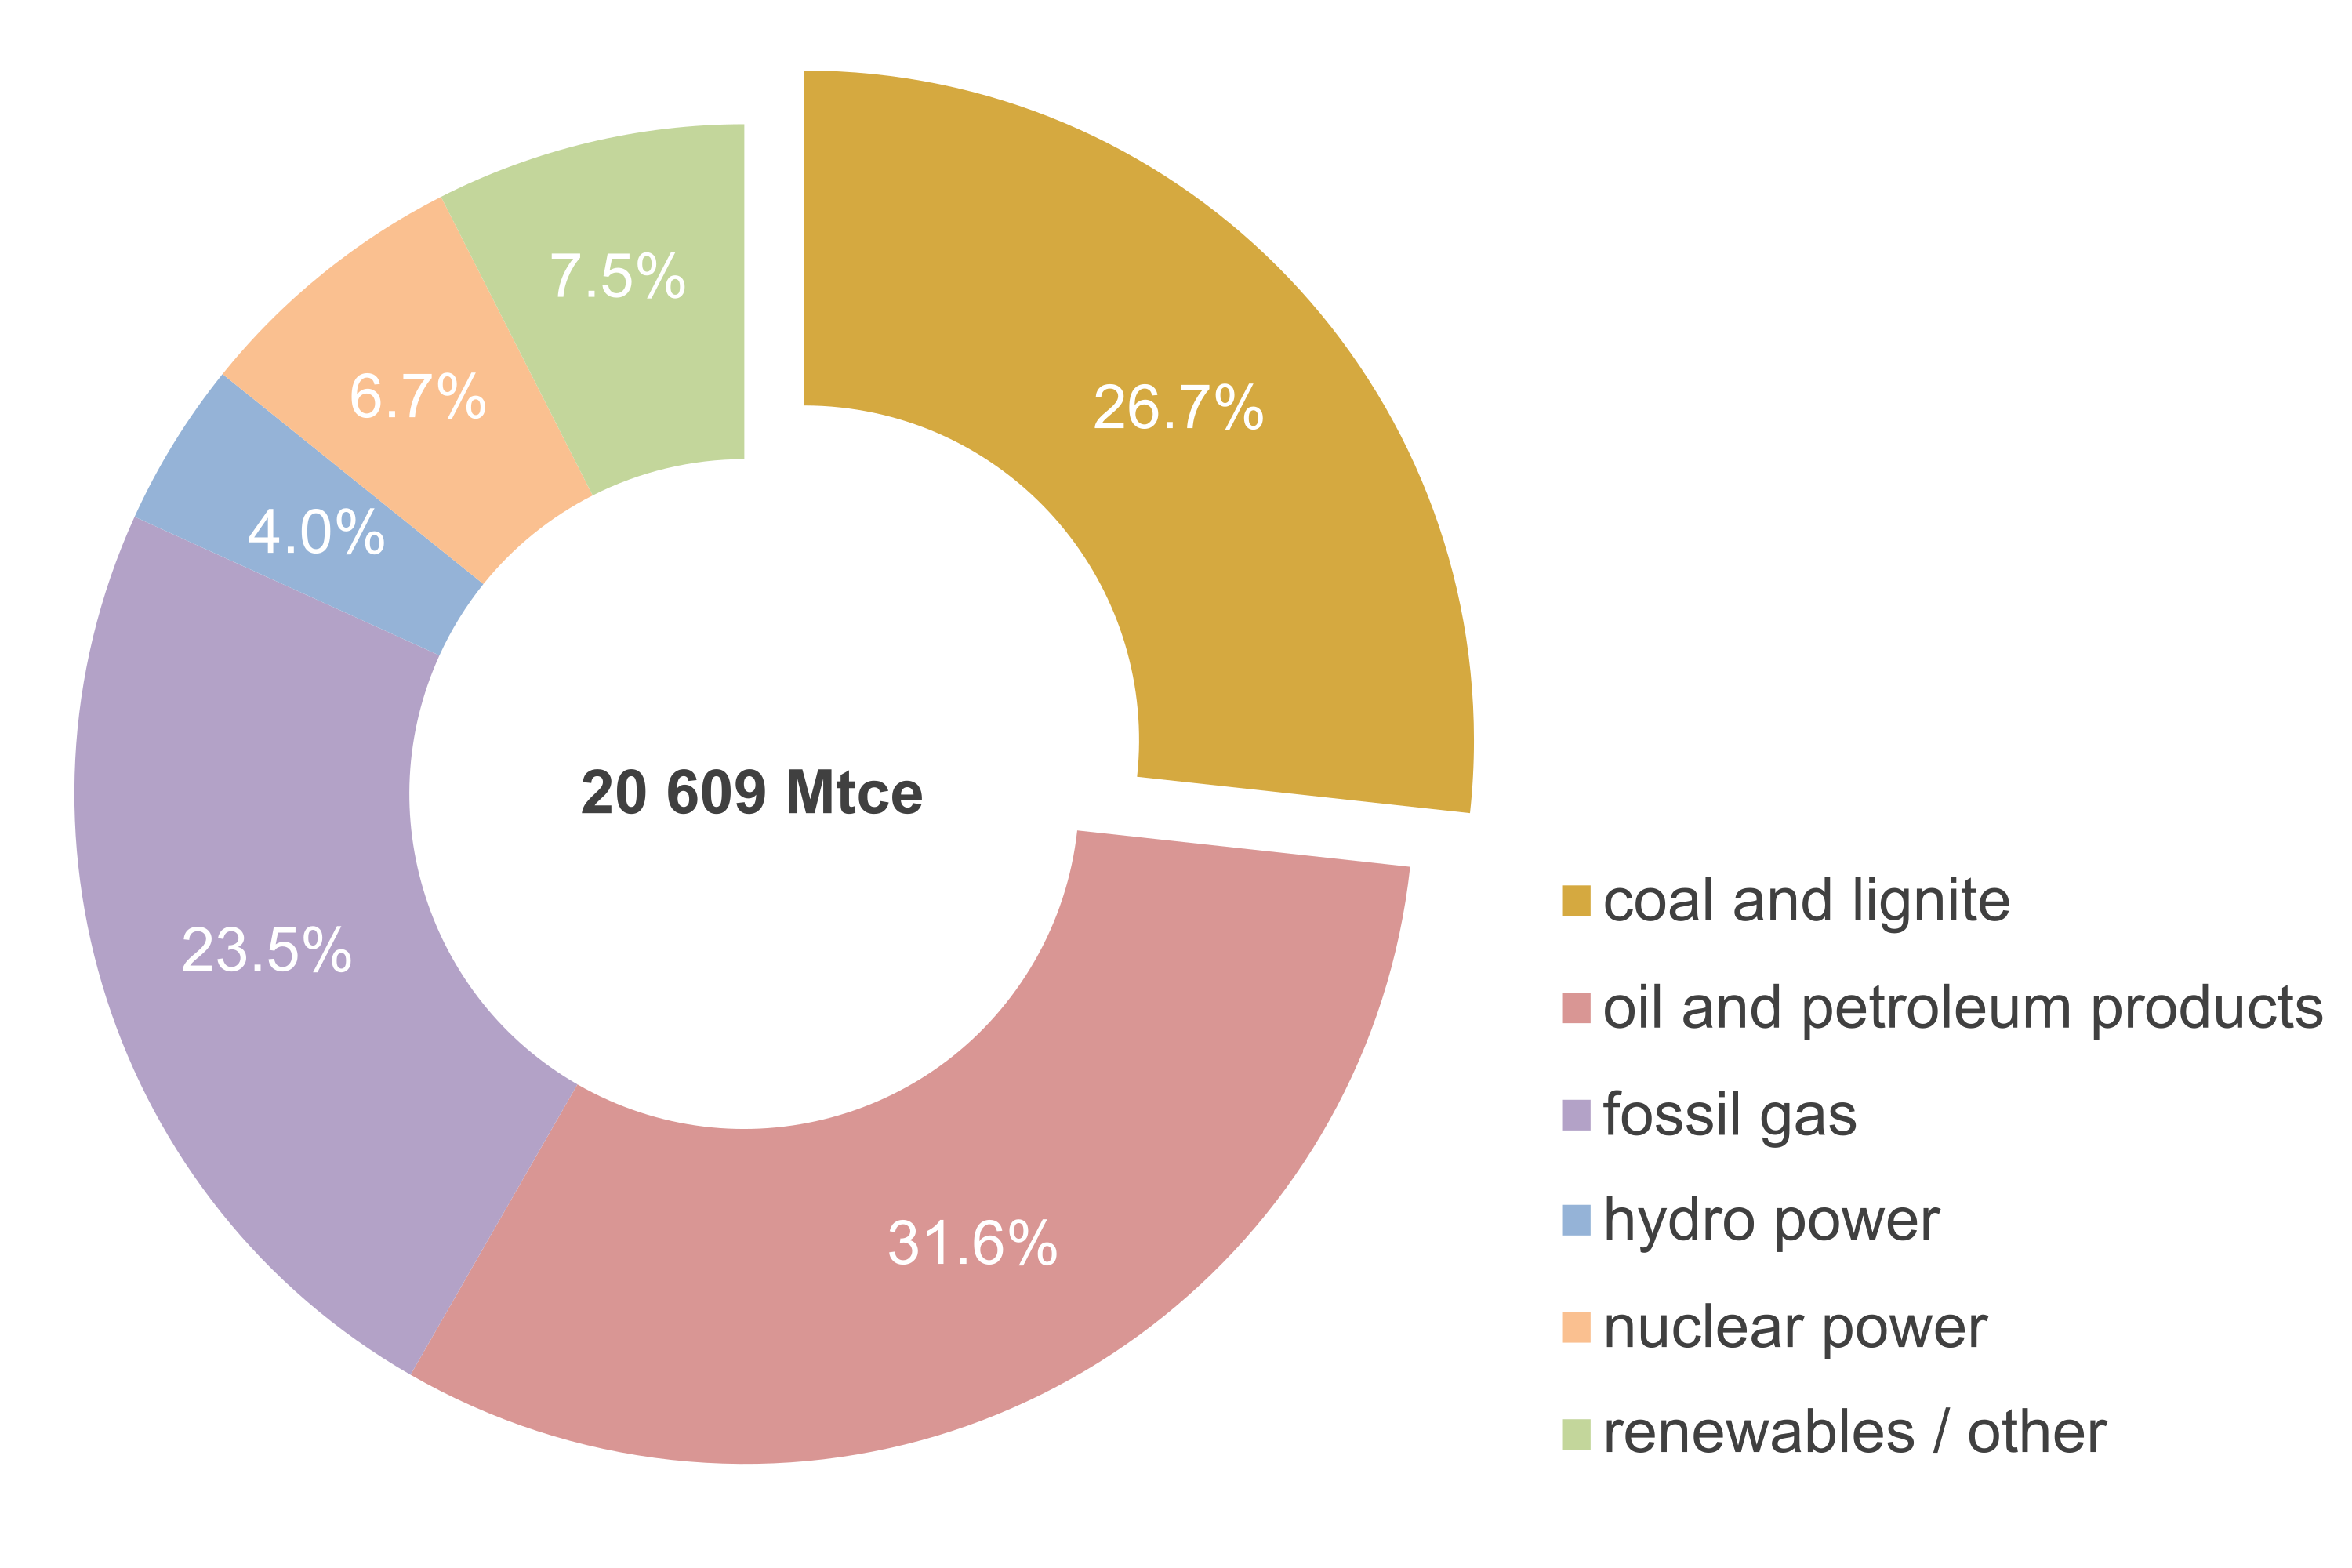
Figure 14 – World total primary energy supply by fuel, 2022 (Source: Energy Institute, 2023 – excludes non-commercial biofuels)
Global energy mix and coal
World total primary energy supply in 2022 was 20 609 million tonnes of coal equivalent (Mtce) of which 26.7% came from coal. Coal is of particular significance for electricity generation. Over one third or 35.4% of global power generation and 17.1% of EU power generation in 2022 was based on coal.

Figure 15 – World electricity generation by fuel, 2022 (Source: Energy Institute, 2023)
According to ENTSO-E (2023), 443 TWh of net electricity generation in the EU came from solid fuels in 2022 (213 TWh from hard coal, 222 TWh from lignite and the remainder from oil shale and peat). Hard coal-fired power plants in the EU have a total net capacity of 80 GW and lignite-fired power plants add a further 49 GW. Individual countries have very different energy mixes for power generation, with coal being indispensable in many (Figure 16 and table on page 83).

Figure 16 – Shares of coal- and lignite-fired power generation in gross power generation around the world, 2021 (Source: IEA databases – including coal gases and coal products)
World coal resources
Coal and lignite are superabundant: total resources are estimated at 15 883 billion tonnes of coal equivalent (Gtce). Less than 2% of the initially in-place coal resources have been extracted. Current coal reserves amount to 779 Gtce – greater than the combined reserves of oil and gas, even when non-conventional oil and gas are included. In fact, coal reserves account for over half of all conventional energy reserves and are distributed more equally than those of oil, gas or uranium.
The world coal market is a freely traded commodity market, which – in contrast to oil and gas markets – is little influenced by geopolitics or the formation of cartels.

Figure 17 – Global hard coal and lignite reserves, 31 December 2021 (Source: BGR, 2023 and own calculations)
EU coal resources
The availability of coal and lignite resources in Europe and around the world, combined with the high productivity of European coal and lignite producers and the diversity of coal exporters to Europe, guarantee a high degree of supply security and competitive prices in the EU. Indigenous energy production, diversified sources of import supply and the storage capacities available at mines, ports and consumers all help to ensure a stable supply chain. Unlike oil and gas, coal does not require large strategic stocks to safeguard against political risks.
Table 2 – Conventional energy reserves in the European Union, 2021 (Source: BGR, 2023 and own calculations)
|
|
Gtce |
share |
|
Hard coal |
23.5 |
56.7% |
|
Lignite |
16.0 |
38.6% |
|
Oil |
0.7 |
1.6% |
|
Fossil gas |
0.6 |
1.4% |
|
Uranium |
0.6 |
1.6% |
|
Total |
41.4 |
100.0% |
International coal market
The largest coal producers in 2022 were China and India, followed by Indonesia and the United States. Australia was the fifth largest producer and is the world’s largest exporter of steam and coking coal by value. The European Union was the seventh largest producer, being the world’s largest producer of lignite by a wide margin. The top‑10 producing countries – which includes Germany – accounted for 93% of total world production.
Table 3 – Largest coal producers, 2022 (Sources: IEA Quarterly Coal Statistics, June 2023; and EURACOAL Market Report 2023 no. 1)
|
|
Steam and coking coal |
|
|
|
|
1 |
China |
4,495.8 |
0.0 |
4,495.8 |
|
2 |
India |
868.1 |
47.6 |
915.7 |
|
3 |
Indonesia |
684.5 |
0.0 |
684.5 |
|
4 |
United States |
496.8 |
43.1 |
539.9 |
|
5 |
Australia |
444.9 |
46.6 |
491.5 |
|
6 |
Russia |
348.6 |
77.6 |
426.2 |
|
7 |
EU-27 |
54.6 |
294.3 |
348.9 |
|
8 |
South Africa |
229.6 |
0.0 |
229.6 |
|
9 |
Kazakhstan |
90.5 |
5.3 |
95.7 |
|
10 |
Türkiye |
1.5 |
87.3 |
88.8 |
|
others |
256.9 |
110.8 |
367.8 |
|
|
World |
7,971.8 |
712.7 |
8,684.4 |
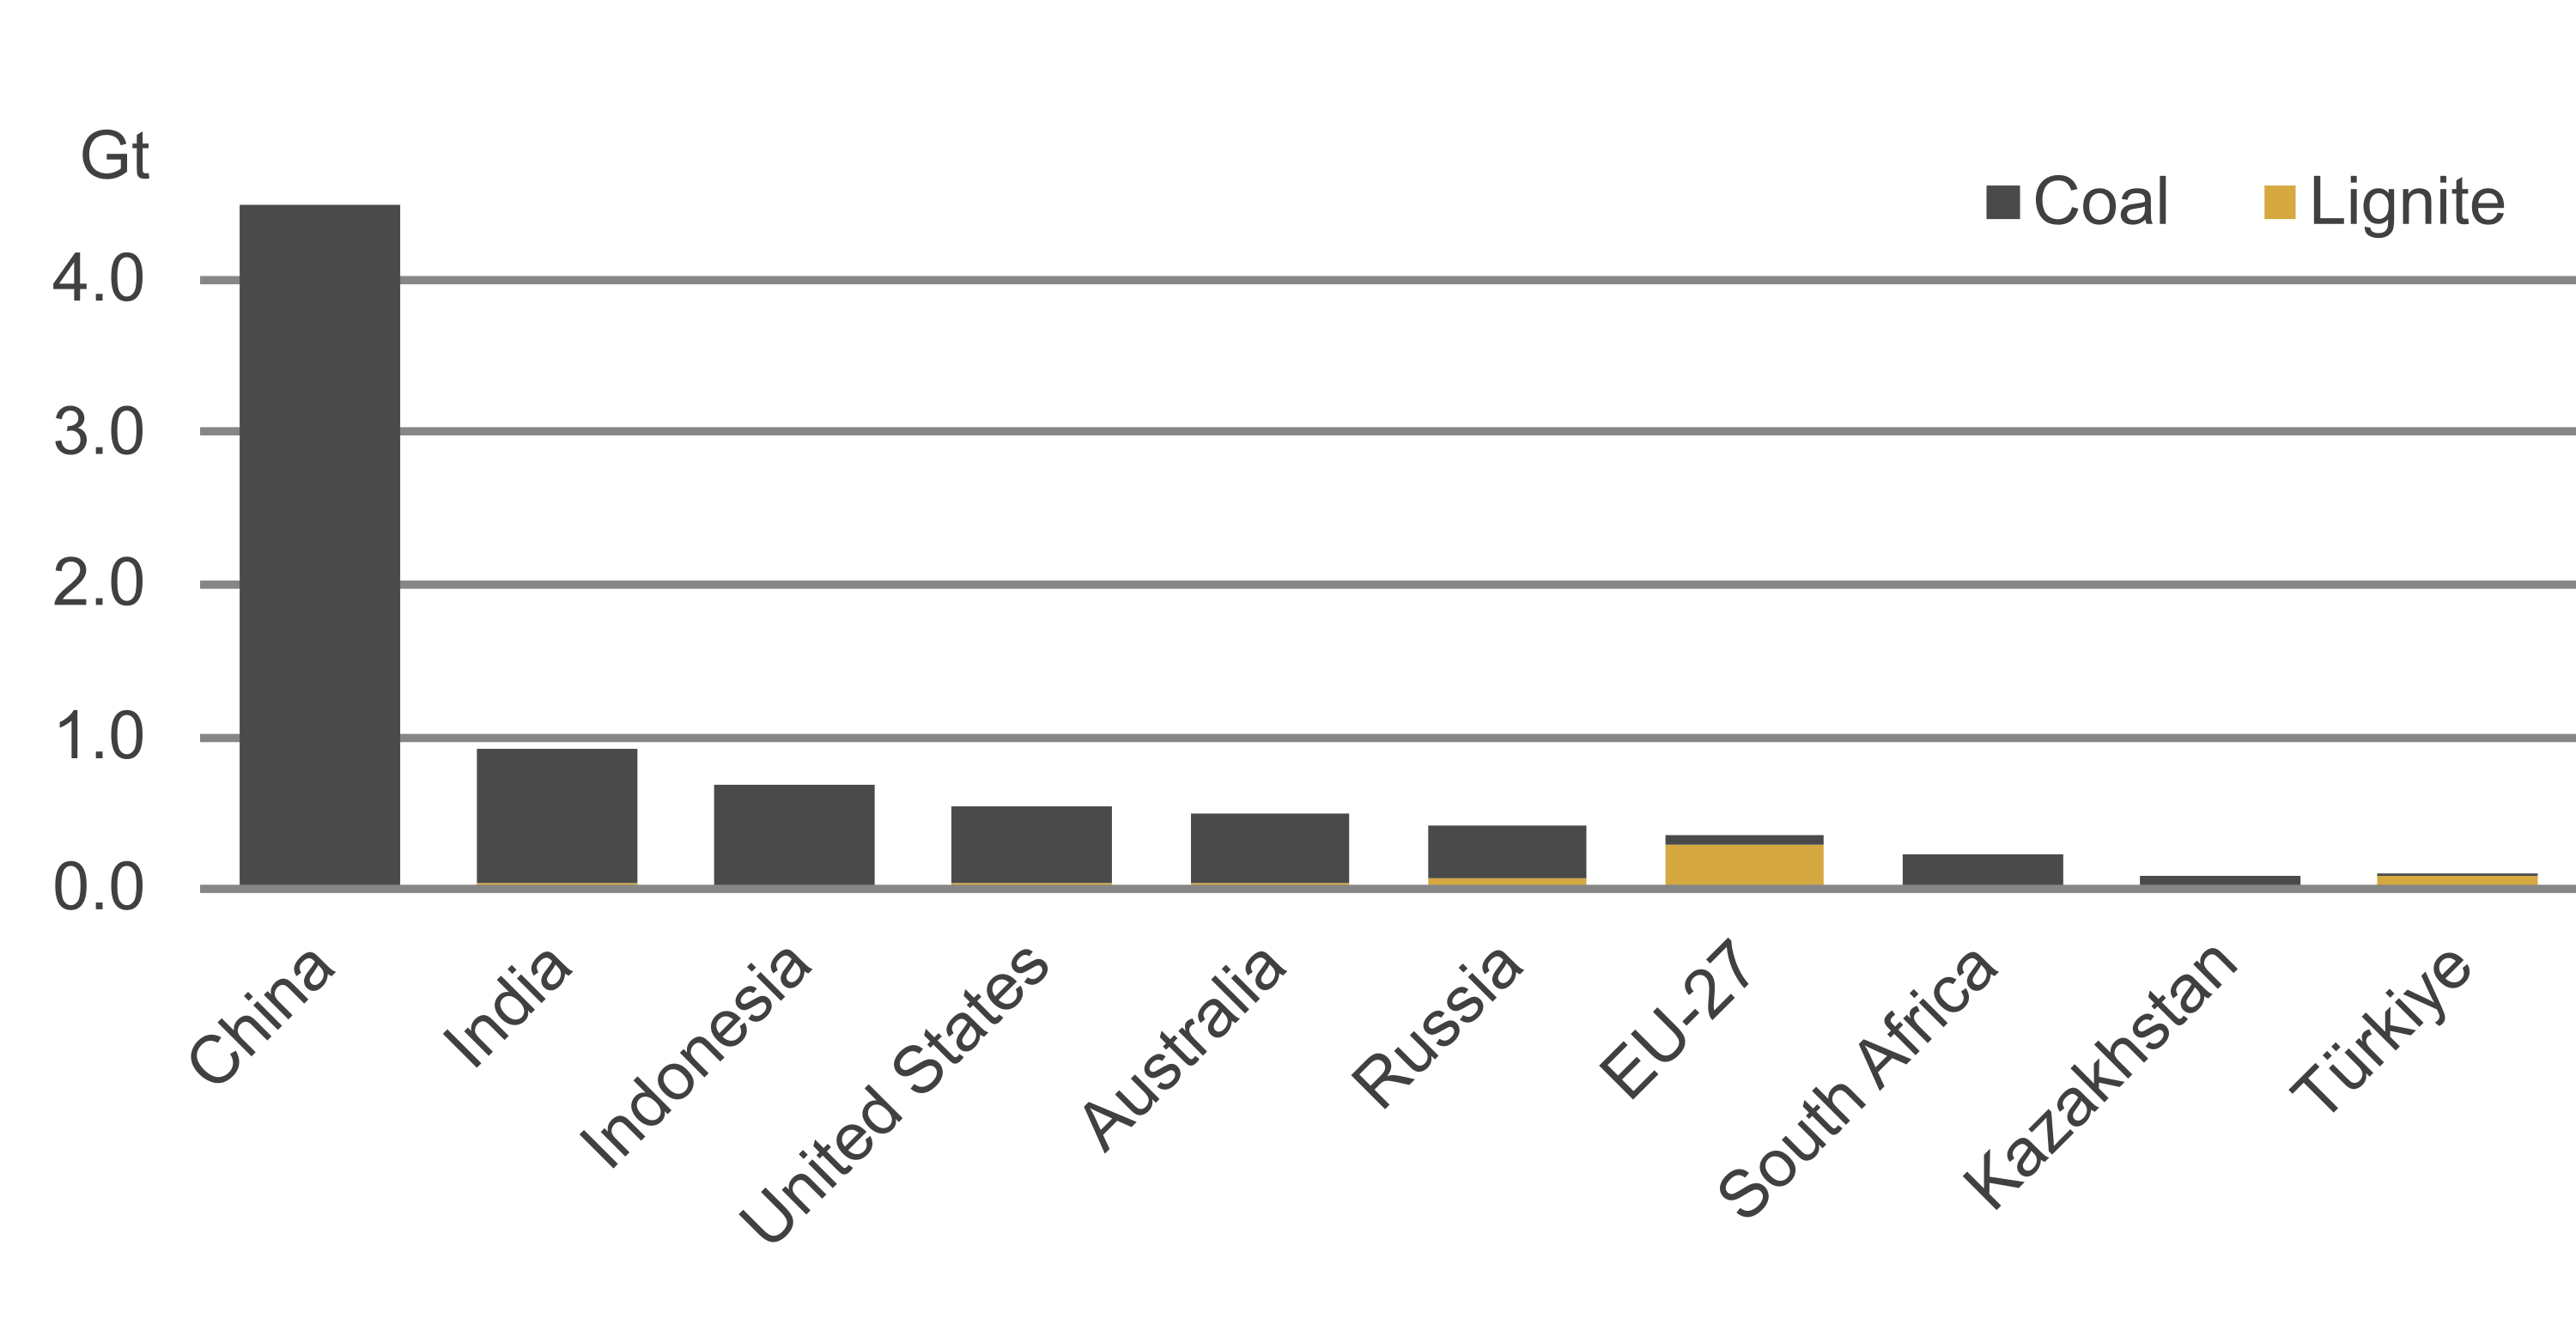
Figure 18 – Largest coal producers in 2022, billion tonnes (Sources: ibid.)
Important exporters of steam coal and coking coal are Indonesia, Australia, Russia, the United States, South Africa and Colombia. Together, they accounted for 90% of all coal exports in 2022. The twenty-seven member states of the European Union accounted for 9.6% of global coal import trade and 5.5% of world coal consumption in 2022.

Figure 19 – Coal imports into the EU by country of origin, 2021 (Sources: Eurostat nrg_ti_sff and nrg_te_sff databases, last updated 03.05.2023)
According to Eurostat data (Figure 19), Russia supplied more than half of the coal imported into the European Union in 2021, followed by Australia and the United States. Other important suppliers included Colombia, Canada and South Africa. New suppliers such as Kazakhstan and Mozambique have emerged, especially since August 2022 when EU sanctions put an end to Russian coal imports.
Table 4 – Largest coal exporters, 2022 (Sources: IEA Quarterly Coal Statistics, June 2023; and *McCloskey by OPIS databases)
|
Country |
Coking coal |
Steam coal |
Total |
|
|
1 |
Indonesia |
1.5 |
470.9 |
472.4 |
|
2 |
Australia |
157.8 |
178.6 |
336.4 |
|
3 |
Russia |
31.9 |
158.9 |
190.8 |
|
4 |
United States |
41.4 |
30.8 |
72.2 |
|
5 |
South Africa |
0.4 |
71.4 |
71.8 |
|
6 |
Colombia |
2.2 |
53.7 |
55.9 |
|
7 |
Canada |
28.1 |
8.2 |
36.3 |
|
8 |
Kazakhstan * |
1.5 |
31.0 |
32.5 |
|
9 |
Mongolia * |
17.0 |
14.7 |
31.7 |
|
10 |
Mozambique * |
4.8 |
8.0 |
12.8 |
|
|
others |
13.4 |
10.0 |
23.4 |
|
World |
299.9 |
1036.2 |
1,336.2 |
Utility scale electricity generation, combined heat and power, and heat production at municipal plants are the main uses of coal in the European Union, accounting in 2022 for two thirds of all coal and lignite use on an energy basis. At 1.1 tonnes per person, the annual per-capita coal consumption of EU citizens matches the global average.
The top coal importing countries are China, India, Japan, Korea, Taiwan and Türkiye, together accounting for 61% of all coal trade in 2022. In the European Union, Germany and Poland were the biggest coal importers in 2022, followed by Italy, Spain, the Netherlands and France.
Table 5 – Largest coal importers, 2022 (Sources: IEA Quarterly Coal Statistics, June 2023; EURACOAL Market Report 2023 no.1; and * McCloskey by OPIS databases)
|
Country |
Coking coal |
Steam coal |
Total |
|
|
1 |
China |
63.8 |
233.2 |
297.0 |
|
2 |
India |
64.7 |
167.0 |
231.7 |
|
3 |
Japan |
64.2 |
116.6 |
180.8 |
|
4 |
EU-27 |
38.3 |
88.5 |
126.8 |
|
5 |
Korea |
22.3 |
102.8 |
125.1 |
|
6 |
Taiwan |
11.1 |
57.0 |
68.1 |
|
7 |
Türkiye |
5.0 |
30.5 |
35.6 |
|
8 |
Malaysia * |
0.0 |
34.5 |
34.5 |
|
9 |
Philippines * |
0.0 |
31.5 |
31.5 |
|
10 |
Viet Nam * |
9.0 |
20.6 |
29.6 |
|
|
others |
24.0 |
137.5 |
161.5 |
|
World |
302.4 |
1,019.8 |
1,322.2 |

Figure 20 – Largest coal importers in 2022, million tonnes (Sources: ibid.)
Global seaborne hard coal trade is estimated at 1 123 million tonnes in 2022, of which 851 million tonnes were steam coal and 272 million tonnes coking coal. Seaborne coal trade can be divided into Pacific and Atlantic markets, each with different supply patterns.

Figure 21 – World traded coal flows in 2022 (Source: VDKi, 2023)
Global energy trends
Future world energy scenarios to 2050 from the International Energy Agency (IEA) and other respected bodies show
only modest increases or even decreases in total primary energy consumption, with similar volumes of oil, coal and fossil gas in the energy supply mix but a growing share of renewables. In scenarios designed for low or net-zero CO2 emissions, the share of renewables overtakes the combined share of conventional energy sources, including fossil,
hydro and nuclear, while energy demand is curtailed below today’s level.

Figure 22 – EU production of coal and lignite (Sources: European Commission, 2021b & 2021c; and IEA, 2022)
Under the European Climate Law of 2021, the EU has agreed to reduce greenhouse gas emissions by at least 55% by 2030, compared with 1990 levels, and reach “climate neutrality” by 2050. Long-term projections by the European Commission show that residual man-made emissions must be balanced by enhanced removals, including carbon capture, use and storage (CCUS). Coal and lignite are expected to have a declining role: by 2050, total EU coal production might be just 38% of current Polish production.

Figure 23 – EU consumption of coal and lignite (Sources: European Commission, 2021b & 2021c; and IEA, 2022)
